Average Total Cost
In economics, average total cost (ATC) equals total fixed and variable costs divided by total units produced. Average total cost curve is typically U-shaped i.e. it decreases, bottoms out and then rises.
A firm’s total cost is the sum of its variable costs and fixed costs. Variable costs are costs which vary with change in output level. Fixed costs, on the other hand, do not change with change in output. Whether amount spent on an input is a variable cost or fixed cost depends on whether we are talking about short-run or long-run. In the short-run, labor is variable cost and capital is fixed but in the long-run, all costs are variables.
Formula
We can write the following equation to express the relationship between total cost (TC), variable costs (VC) and fixed costs (FC):
$$ \text{TC}\ =\ \text{VC}\ +\ \text{FC} $$
If we divide both sides of the above equation with output Q, we get a relationship between average total cost (ATC), average variable cost (AVC) and average fixed cost (AFC):
$$ \frac{\text{TC}}{\text{Q}}\ =\ \frac{\text{VC}}{\text{Q}}\ +\ \frac{\text{FC}}{\text{Q}} $$
$$ \text{ATC}\ =\ \text{AVC}\ +\ \text{AFC} $$
It shows that average total cost is the sum of average variable cost and average fixed cost.
Example
Let’s consider a firm whose total cost function is given by the following equation:
$$ \text{TC}\ =\ \text{0.1Q}^\text{3}-\ \text{3Q}^\text{2}+\text{60Q}+\text{200}\ $$
If we divide this equation by output Q, we get the firm's average total cost function:
$$ \text{ATC}\ =\ \frac{\text{TC}}{\text{Q}}\ =\ \frac{\text{0.1Q}^\text{3}-\ \text{3Q}^\text{2}+\text{60Q}+\text{200}}{\text{Q}}\ $$
$$ \text{ATC}\ =\ \ \text{0.1Q}^\text{2}-\ \text{3Q}+\text{60}+\frac{\text{200}}{\text{Q}} $$
Plotting this function, we get the average total cost curve. We have also plotted average fixed cost and average variable cost curves so we can see what is ultimately driving the average total cost curve.
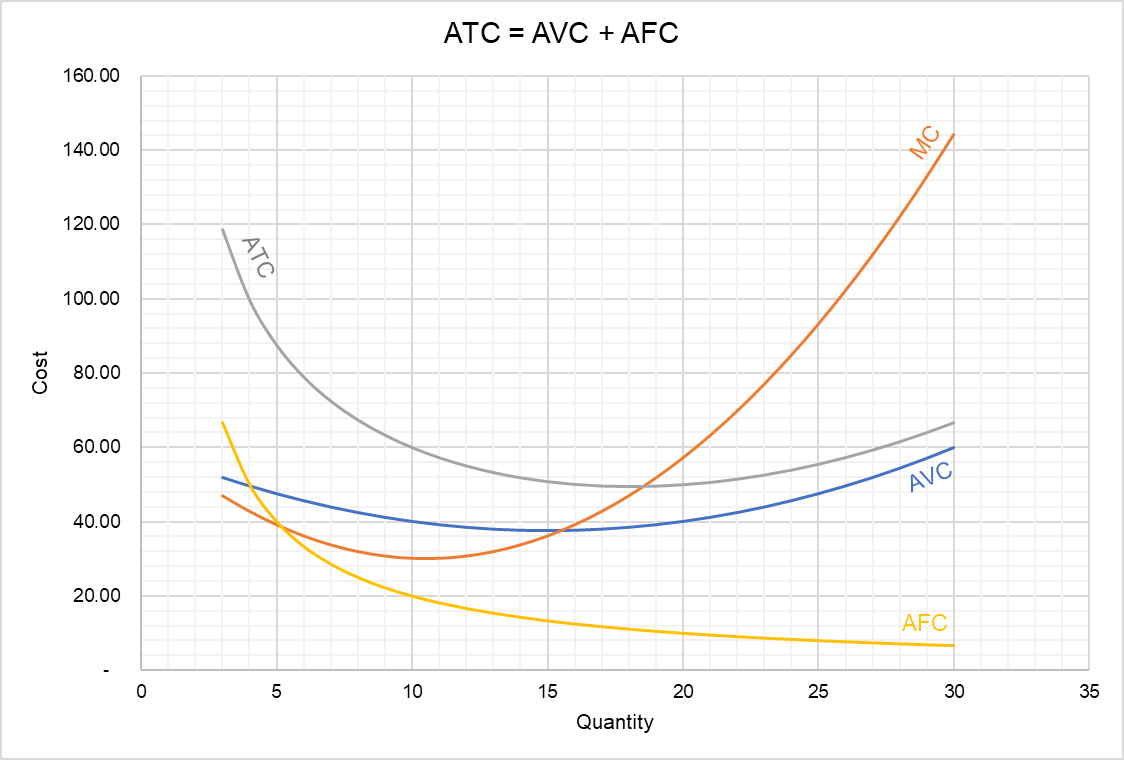
It is evident from the graph above that the average total cost curve initially falls, bottoms out around 18 units and then rises. It falls because as the output increase, the fixed cost is spread over more and more units. But the effect of this reduction progressively fades away because the marginal unit results in smaller and smaller reduction in average fixed cost. ATC ultimately starts climbing when the average variable cost curve starts to slope up. In fact, the average total cost curve is the vertical summation of average variable cost curve and average fixed cost curve.
by Obaidullah Jan, ACA, CFA and last modified on