Security Market Line
Security market line (SML) is a graph that plots the required return on investments with reference to its beta coefficient, a measure of systematic risk. Security market line represents the capital asset pricing model which measures required returns as equal to the risk-free rate plus the product of beta coefficient and market risk premium.
The security market line differs from the capital market line (CML) which plots the required return on a portfolio of risk-free asset and the market portfolio with reference to the portfolio’s standard deviation. Capital market line (CML) in turn is a special case of the capital allocation line (CAL). Capital allocation line is the graph of a portfolio of risk-free asset and ANY portfolio of risky assets while the capital market line is the graph of the capital allocation line that is tangent to the efficient frontier.
Stocks that are plotted above the security market line are undervalued. It is because they have higher required return than the required return justified by the capital asset pricing model. Similarly, stocks that fall below the security market line are overvalued because they have lower required return than the fair-value return suggested by the capital asset pricing model and hence high stock price.
Formula
The following equation is the mathematical express of the security market line:
$$ \text{r} _ \text{e}=\text{r} _ \text{f}+\beta\times(\text{r} _ \text{m}-\text{r} _ \text{f}) $$
Where re is the required return on an asset, rf is the risk-free rate, β is the beta coefficient which measures the extent to which a stock’s return must change in response to a change in systematic risk.
Example
If the risk-free rate is 3.5% and the equity risk premium is 5%, find out if the below investments are overvalued or undervalued given their beta coefficient and required rate of return observed using the dividend discount model:
| Stock | Beta | Observed Required Return |
|---|---|---|
| A | 1.1 | 8% |
| B | 1.3 | 12% |
| C | 1.2 | 9% |
| D | 1.9 | 15% |
| E | 0.7 | 7% |
Using the capital asset pricing model equation (which is also the equation for the security market line), we can work out the justified required rate of return on each stock as follows:
| Stock | Beta | Required Return (DDM) |
Required Return as per CAPM |
Formula |
|---|---|---|---|---|
| A | 1.1 | 8% | 9.00% | = 3.5% + 1.1 × 5% |
| B | 1.3 | 12% | 10.00% | = 3.5% + 1.3 × 5% |
| C | 1.2 | 9% | 9.50% | = 3.5% + 1.2 × 5% |
| D | 1.9 | 15% | 13.00% | = 3.5% + 1.9 × 5% |
| E | 0.7 | 7% | 7.00% | = 3.5% + 0.7 × 5% |
If we plot the justified required rate of return and the required rate of return observed in the market i.e. the required return extracted from the current price using the dividend discount model, we can see whether they fall on the security market line.
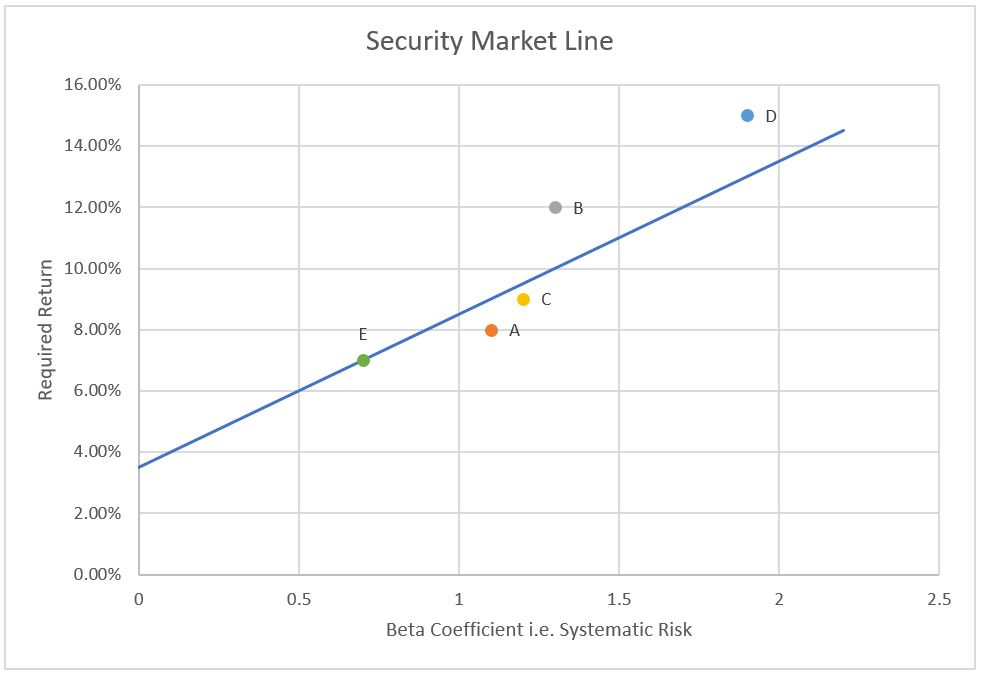
Stock B and D are overvalued because their observed required returns (as per DDM) are higher than the justified required returns (as per CAPM) and they appear above the security market line.
Stock A and C are overvalued because their observed required returns are lower than required returns that should prevail given their systematic risk. They appear below the security market line.
Only Stock E is fairly-valued because it appears on the security market line. It is because its observed required return and CAPM required return are same.
by Obaidullah Jan, ACA, CFA and last modified on