Marginal Cost of Capital
Marginal cost of capital is the weighted average cost of the last dollar of new capital raised by a company. It is the composite rate of return required by shareholders and debt-holders for financing new investments of the company. It is different from the average cost of capital which is based on the cost of equity and debt already issued.
The weighted average cost of capital (WACC), the most common measure of cost of capital used in capital budgeting and business valuation, is the weighted average of the marginal cost of common stock, marginal cost of preferred stock and marginal after-tax cost of debt.
The distinction between average cost of capital and marginal cost of capital is important. The marginal cost of capital rises as the company raises more and more capital. This is because capital is scarce, just like any other factor of production, and must be compensated through a higher required return. The return available on new projects must be compared with the marginal cost of capital and not the average cost of capital and the projects should be accepted only when the expected return is higher than the required return.
Marginal cost of capital increases in steps and not linearly. This is because a company can finance a certain portion of new investments by reinvesting earnings and raising enough debt and/or preferred stock to maintain the target capital structure. The reinvestment of earnings comes without any increase in cost of equity. However, as soon as the expected capital exceeds the combined amount of retained earnings and debt and/or preferred stock raised to maintain the target capital structure, the marginal cost of capital increases.
Break Point
Break point is the total amount of new investments that can be financed and the new capital that can be raised before a jump in marginal cost of capital is expected. It is the point at which the marginal cost of capital curve breaks out from its flat trend.
The break point can be worked out by dividing the retained earnings for the period by the weight of the retained earnings in the target capital structure. The retained earnings in a period equals the product of net income for the period and the retention rate (also called plow-back rate), which equals 1 minus the dividend payout ratio.
The following equation can be used to calculate the break point:
| Break Point = | NI × (1 - DPR) |
| We |
Where NI is the net income for the period, DPR is the dividend payout ratio, i.e. the dividends declared dividend by net income and We is the weight of retained earnings in the target capital structure.
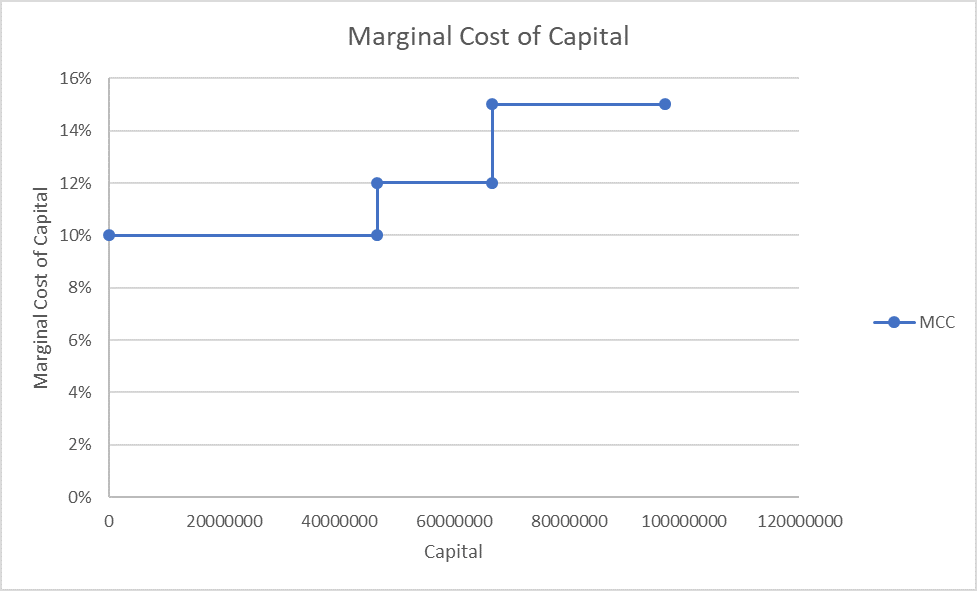
The break points are helpful in creating the marginal cost of capital curve, a graph that plots capital raised on the X-axis and marginal weighted average cost of capital on the Y-axis.
Your company's marginal cost of capital was 10% at the start of 2017. Its net income for the year was $30 million, 30% of which was paid out in dividends. Retained earnings form 45% of the target capital structure of the company.
The company's break point equals retained earnings for the period divided by proportion of retained earnings in target capital structure.
Retained earnings for the period equals $21,000,000 (i.e. $30,000,000 × (1 – 30%)).
| Break Point = | $21,000,000 | = $46.67 million |
| 0.45 |
The new marginal cost of capital once $46.67 million of capital is raised is 12%.
Using the above data, the marginal cost of capital curve can be graphed as follows:
Investment Opportunity Schedule
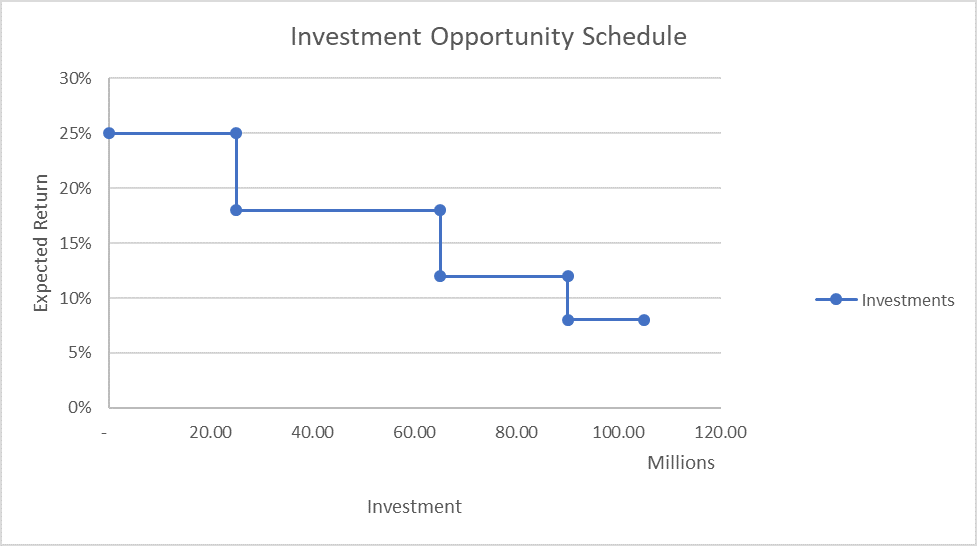
Investment opportunity schedule is the table/graph of cumulative investment opportunities and their expected return. It plots the expected return on the Y-axis and the initial investment required on the X-axis. The investment opportunity schedule is a down-ward sloping curve because investment opportunities are rare and each new opportunity is expected to generate a diminishing return.
Let's say the following is a list of potential investment opportunities available to your company and their expected return:
| Project | Initial Investment | Expected Return |
|---|---|---|
| A | $25,000,000 | 25% |
| B | $40,000,000 | 18% |
| C | $25,000,000 | 12% |
| D | $15,000,000 | 8% |
The investment opportunity schedule can be plotted as follows:
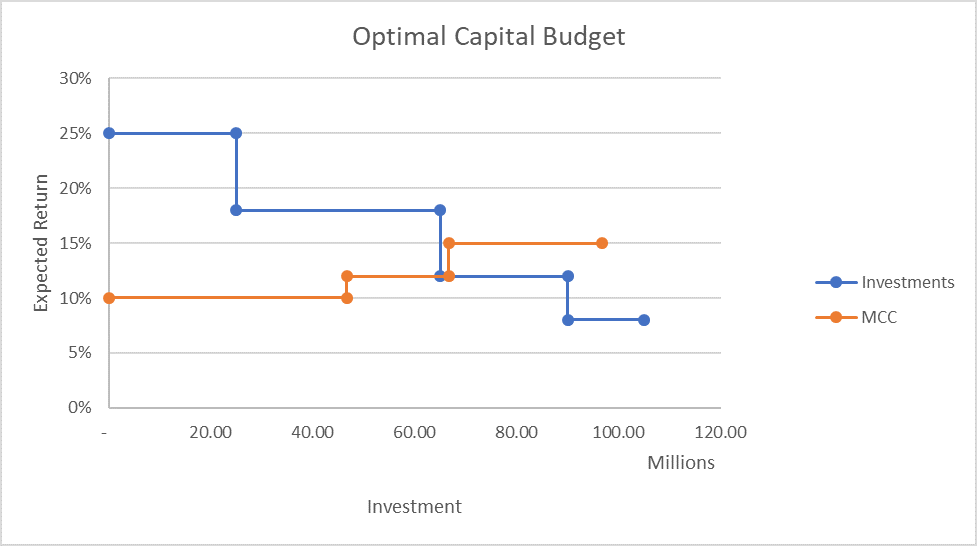
Optimal Capital Budget
A company's optimal capital budget is the point at which its marginal cost of capital equals the incremental expected return. A company should raise new capital as long as the marginal cost of capital is lower than or equal to the available return.
The following chart plots the marginal cost of capital and investment opportunity schedule. The point of intersection of the marginal cost of capital curve and investment opportunity schedule is the optimal capital budget.
by Obaidullah Jan, ACA, CFA and last modified on