Break-even Analysis
In management accounting, break-even analysis is a technique aimed at finding the level of sales (in units or dollars) at which a company is neither making a profit nor incurring a loss.
Sales level at which a company just covers all of its costs (i.e. breaks even) is called the break-even point. Knowing the break-even point is important because once this sales level is achieved, any additional sales result in increase in operating income.
Companies most interested in finding their break-even point include start-ups because they have significant cash burn rate and are eager to earn their first dollar in profit); companies which have high fixed costs, because a small change in sales affects their bottom line significantly); and companies which are incurring losses, because they need to know sales level at which they will turn to profit).
Break-even point in units vs dollars
The break-even point is expressed either in units of goods sold or in dollars of sales, but the distinction is trivial because one measure can be easily converted to the other using the following relationship:
$$ \text{BEP in Dollars}\ =\ \text{BEP in Units}\ \times \text{Price per Unit} $$
There are different ways in which companies can identify their break-even point: using a formula, using the cost-volume-profit equation or using the break-even chart.
Break-even point formulas
$$ \text{BEP}\ (\text{in Units})=\frac{\text{Fixed Costs}}{\text{Contribution Margin per Unit}} $$
Where the contribution margin per unit equals price per unit P minus variable cost per unit V:
$$ \text{BEP}\ (\text{in Units})=\frac{\text{Fixed Costs}}{\text{P}\ -\ \text{V}} $$
The break-even point in dollars can be worked out directly using the following formula:
$$ \text{BEP}\ (\text{in Dollars})=\frac{\text{Fixed Costs}}{\text{Contribution Margin Ratio}} $$
Where contribution margin ratio equals contribution margin per unit i.e. P – V divided by price per unit P:
$$ \text{BEP}\ (\text{in Dollars})=\frac{\text{Fixed Costs}}{{\frac{\text{P}\ -\ \text{V}}{\text{P}}}} $$
Understanding the break-even point mathematics
If you ever forget the formulas given above, don’t worry. You can find out the break-even point using the following basic cost-volume-profit relationship:
$$ \text{Profit}\ =\ \text{Sales}\ -\ \text{Variable Costs}\ -\ \text{Fixed Costs} $$
Where sales are the product of quantity Q and price P, variable costs are the product of quantity Q and variable cost per unit and fixed costs FC are constant:
$$ \text{Profit}\ =\ \text{Q}\times \text{P}\ -\ \text{Q}\times \text{V}\ - \text{FC} $$
$$ \text{Profit}\ =\ \text{Q}\times (\text{P}\ -\ \text{V})\ - \text{FC} $$
Since profit is zero at the break-even point, setting the left-hand side of the equation as zero:
$$ \text{0}\ =\ \text{Q}\times(\text{P}\ -\ \text{V})\ - \text{FC} $$
Moving fixed cost to the left-hand side and isolating Q on the right-hand side
$$ \frac{\text{FC}}{\text{P}\ -\text{V}}=\text{Q} $$
Swapping the position:
$$ \text{Q}=\frac{\text{FC}}{\text{P}\ -\text{V}} $$
Where Q is the break-even point in units. The denominator in the above equation (P – V) equals contribution margin per unit. This gives us the formula for break-even point in units:
$$ \text{Q}=\frac{\text{FC}}{\text{CM per Unit}} $$
Now, let’s derive the formula for break-even point in dollars. Just multiply both sides of the above equation with price per unit P:
$$ \text{Q}\ \times\ \text{P}=\frac{\text{FC}}{\text{CM per Unit}}\times \text{P} $$
The product of break-even point in units Q and price per unit P equals the break-even point in dollars S. A bit of mathematical manipulation on the right-hand side gives us the contribution margin ratio in the denominator.
$$ \text{S}=\frac{\text{FC}}{{\frac{\text{CM per Unit}}{\text{P}}}}=\frac{\text{FC}}{\text{CM Ratio}} $$
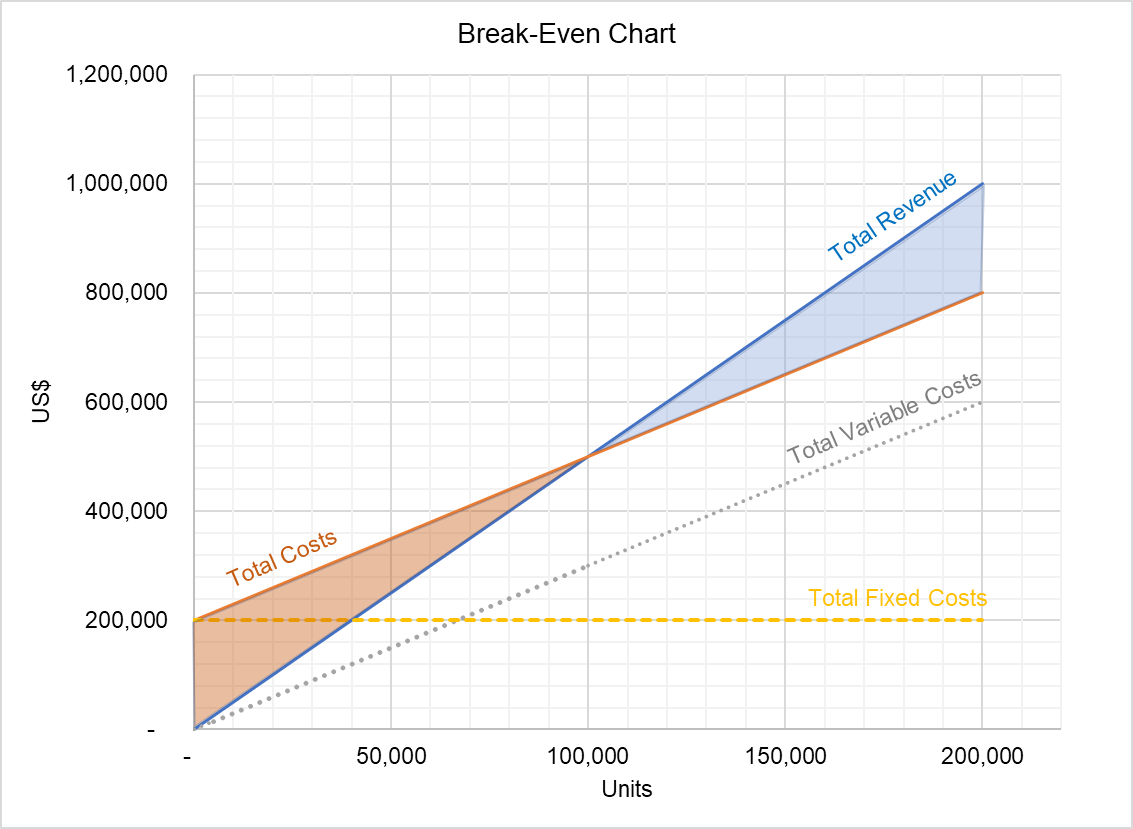
You can also find-out the break-even point using the break-even chart (also called cost-volume-profit graph). If you plot the total revenue and total cost curves, the break-even point occurs at the point of intersection of these curves as shown below.
Margin of safety vs break-even point
Once you know your break-even point, you must compare it with your actual or expected sales. If your actual or expected sales are higher than your break-even point, the difference (in units, dollars or a percentage) is called your margin of safety.
$$ \text{Margin of Safety}\ =\ \text{Actual Sales}\ -\ \text{Breakeven Point} $$
You should try not to be in a position in which your margin of safety in negative because it would mean that you are incurring losses.
by Obaidullah Jan, ACA, CFA and last modified on